Automatically Extract Continuous Columns in Pandas

Introduction
This article will discuss several tips and shortcuts for using iloc to work with a data set that has a large number of columns. Even if you have some experience with using iloc you should learn a couple of helpful tricks to speed up your own analysis and avoid typing lots of column names in your code.
Why Do We Care About Selecting Columns?
In many standard data science examples, there are a relatively small number of columns. For example, Titanic has 8, Iris has 4, and Boston Housing has 14. Real-life data sets are messy and often include a lot of extra (potentially unnecessary) columns.
In data science problems you may need to select a subset of columns for one or more of the following reasons:
- Filtering the data to only include the relevant columns can help shrink the memory footprint and speed up data processing.
- Limiting the number of columns can reduce the mental overhead of keeping the data model in your head.
- When exploring a new data set, it might be necessary to break to task into manageable chunks.
- In some cases, you may need to loop through columns and perform calculations or cleanups in order to get the data in the format you need for further analysis.
- Your data may just contain extra or duplicate information which is not needed.
Regardless of the reason, you may not need these techniques all the time. When you do, though, the tricks outlined below can reduce the amount of time you spend wrangling columns of data.
Also, if you like this type of content, I encourage you to check out Kevin Markham's pandas tricks which served as an inspiration for a couple of the tips below.
The Data
In order to illustrate some examples, I'm going to use a quirky data set from the Central Park Squirrel Census. Yes, apparently there was an effort to count and catalog squirrels in Central Park. I thought this would be a fun example to work through. It also gave me a chance to include a squirrel image (credit: GeorgeB2) in my post :) .
This data set includes 3,023 rows of data and 31 columns. While 31 columns is not a tremendous number of columns, it is a useful example to illustrate the concepts you might apply to data with many more columns.
If you want to follow along, you can view the notebook or pull it directly from github.
Let's get started by reading in the data.
import pandas as pd import numpy as np df = pd . read_csv ( 'https://data.cityofnewyork.us/api/views/vfnx-vebw/rows.csv?accessType=DOWNLOAD&bom=true&format=true' ) Sometimes it gets tricky to remember each column name and where it is by index. Here is a simple list comprehension to build up a reference list of all columns and their index.
col_mapping = [ f " { c [ 0 ] } : { c [ 1 ] } " for c in enumerate ( df . columns )] Which creates a list like this:
[ '0:X' , '1:Y' , '2:Unique Squirrel ID' , '3:Hectare' , '4:Shift' , '5:Date' , ... '33:Borough Boundaries' , '34:City Council Districts' , '35:Police Precincts' ] In some cases if you might want to rename a bunch of columns, you can use a dictionary comprehension to create a dictionary view of the data:
col_mapping_dict = { c [ 0 ]: c [ 1 ] for c in enumerate ( df . columns )} Which creates this dictionary:
{ 0 : 'X' , 1 : 'Y' , 2 : 'Unique Squirrel ID' , 3 : 'Hectare' , 4 : 'Shift' , 5 : 'Date' , ... 33 : 'Borough Boundaries' , 34 : 'City Council Districts' , 35 : 'Police Precincts' } Having these variables defined can be useful as you progress through your analysis. Instead of repeatedly looking at your original file, you can just double check the variable name during your analysis.
One other common task I frequently have is to rename a bunch of columns that are inconsistently named across files. I use a dictionary to easily rename all the columns using something like df.rename(columns=col_mapping) Typing all the column names can be an error prone task. A simple trick is to copy all the columns in excel and use pd.read_clipboard() to build a small DataFrame and turn the columns into a dictionary. I can then manually type in the new names, if need be.
Here is a quick example with this data set. Note that we pass in the sep to parse a tab delimited string:
df_cols = pd . read_clipboard ( sep = ' \t ' ) col_mapping = { c [ 1 ]: '' for c in enumerate ( df_cols . columns )} Which creates a dictionary that is relatively easy to populate with new names:
{ 'X' : '' , 'Y' : '' , 'Unique' : '' , 'Squirrel' : '' , 'ID' : '' , 'Hectare' : '' , 'Shift' : '' , ... 'Police' : '' , 'Precincts' : '' } As an added bonus, you could even use an Excel file to set up the column renaming and automate the whole process. That tip is outside the scope of this article. If you are interested though, let me know in the comments.
Using iloc
The primary function we will walk through is panda's iloc which is used for integer-location based indexing. New users may be slightly confused because iloc and loc can take a boolean-array which leads to more powerful indexing. Since both functions can take a boolean array as input, there are times when these functions produce the same output. However, for the scope of this post, I will focus only on iloc column selection.
Here's a simple graphic to illustrate the primary usage for iloc :
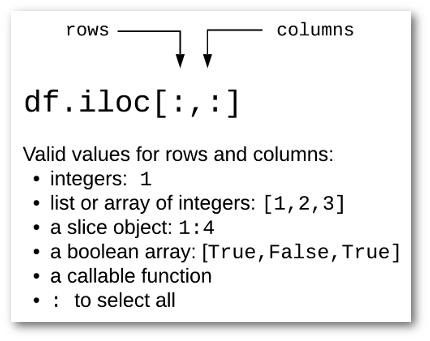
For instance, if you want to look at just the Squirrel ID column of data for all rows:
0 37F-PM-1014-03 1 37E-PM-1006-03 2 2E-AM-1010-03 3 5D-PM-1018-05 4 39B-AM-1018-01 ... 3018 30B-AM-1007-04 3019 19A-PM-1013-05 3020 22D-PM-1012-07 3021 29B-PM-1010-02 3022 5E-PM-1012-01 Name: Unique Squirrel ID, Length: 3023, dtype: object
If you want to look at the X and Y location as well as the ID, you can pass in a list of integers [0,1,2] :
| X | Y | Unique Squirrel ID | |
|---|---|---|---|
| 0 | -73.956134 | 40.794082 | 37F-PM-1014-03 |
| 1 | -73.957044 | 40.794851 | 37E-PM-1006-03 |
| 2 | -73.976831 | 40.766718 | 2E-AM-1010-03 |
| 3 | -73.975725 | 40.769703 | 5D-PM-1018-05 |
| 4 | -73.959313 | 40.797533 | 39B-AM-1018-01 |
| … | … | … | … |
| 3018 | -73.963943 | 40.790868 | 30B-AM-1007-04 |
| 3019 | -73.970402 | 40.782560 | 19A-PM-1013-05 |
| 3020 | -73.966587 | 40.783678 | 22D-PM-1012-07 |
| 3021 | -73.963994 | 40.789915 | 29B-PM-1010-02 |
| 3022 | -73.975479 | 40.769640 | 5E-PM-1012-01 |
3023 rows × 3 columns
Typing all the columns is not the most efficient, so we can use slicing notation to make this a little easier to understand:
Which will generate the same output as above.
If you have some experience with python lists, and have used pandas a bit; all of this usage should make sense. These points are pandas 101 concepts but we will build up from here.
While both of these approaches are straightforward, what if you want to combine the list of integers with the slice notation? You might try something like this:
File "<ipython-input-56-6f5b3426f412>", line 1 df.iloc[:, [0:3,15:19]] ^ SyntaxError: invalid syntax Or, you could try something like this:
IndexingError: Too many indexers Hmmm. That obviously doesn't work but seems like it would be useful for selecting ranges as well as individual columns.
Fortunately there is a numpy object that can help us out. The r_ object will "Translate slice objects to concatenation along the first axis." It might not make much sense from the documentation but it does exactly what we need.
Here's a slightly more elaborate example to show how it works on a combination of individual list items and sliced ranges:
array([ 0, 1, 2, 15, 16, 17, 18, 24, 25]) That's kind of cool. This object has converted the combination of integer lists and slice notation into a single list which we can pass to iloc :
df . iloc [:, np . r_ [ 0 : 3 , 15 : 19 , 24 , 25 ]] | Y | Unique Squirrel ID | Date | Hectare Squirrel Number | Age | Running | Chasing | Climbing | Eating | Foraging | Other Activities | Kuks | Quaas | Moans | Tail flags | Tail twitches | Approaches | Indifferent | Runs from | Other Interactions | |
|---|---|---|---|---|---|---|---|---|---|---|---|---|---|---|---|---|---|---|---|---|
| 0 | 40.794082 | 37F-PM-1014-03 | 10142018 | 3 | NaN | False | False | False | False | False | NaN | False | False | False | False | False | False | False | False | NaN |
| 1 | 40.794851 | 37E-PM-1006-03 | 10062018 | 3 | Adult | True | False | False | False | False | NaN | False | False | False | False | False | False | False | True | me |
| 2 | 40.766718 | 2E-AM-1010-03 | 10102018 | 3 | Adult | False | False | True | False | False | NaN | False | False | False | False | False | False | True | False | NaN |
| 3 | 40.769703 | 5D-PM-1018-05 | 10182018 | 5 | Juvenile | False | False | True | False | False | NaN | False | False | False | False | False | False | False | True | NaN |
| … | … | … | … | … | … | … | … | … | … | … | … | … | … | … | … | … | … | … | … | … |
| 3019 | 40.782560 | 19A-PM-1013-05 | 10132018 | 5 | Adult | False | False | False | False | True | NaN | False | False | False | False | False | False | True | False | NaN |
| 3020 | 40.783678 | 22D-PM-1012-07 | 10122018 | 7 | Adult | False | False | False | True | True | NaN | False | False | False | False | False | False | True | False | NaN |
3023 rows × 20 columns
Here is another tip. You may also use this notation when reading data using read_csv :
df_2 = pd . read_csv ( 'https://data.cityofnewyork.us/api/views/vfnx-vebw/rows.csv?accessType=DOWNLOAD&bom=true&format=true' , usecols = np . r_ [ 1 , 2 , 5 : 8 , 15 : 30 ], ) I find this notation helpful when you have a data set where you want to keep non-sequential columns and do not want to type out the full names of all the columns.
One caveat I would make is that you need to be careful when using the slice notation and keep in mind that the last number in the range will not be included in the generated list of numbers.
For example, if we specify the range 2:4 , we only get a list of 2 and 3:
If you want to include column index 4, use np.r_[2:5] .
One final comment on np.r_ is that there is an optional step argument. In this example, we can specify that this list will increment by 2:
This is a bit of a more advanced option and is not going to be intuitively obvious to a new pandas user. However if you ever find yourself parsing a lot of columns by index, this might be a useful tool to navigate a tricky scenario.
iloc and boolean arrays
One of the most powerful ways to filter columns is to pass a boolean array to iloc to select a subset of columns. This sounds a little complex but a couple of examples should make this understandable.
The most important concept is that we don't generate a boolean array by hand but use the output from another pandas function to generate the array and feed it to iloc .
In this case, we can use the str accessor on a column index just like any other column of pandas data. This will generate the necessary boolean array that iloc expects. An example should help make this clear.
If we want to see which columns contain the word "run":
run_cols = df . columns . str . contains ( 'run' , case = False ) print ( run_cols ) array([False, False, False, False, False, False, False, False, False, False, False, False, False, False, False, True, False, False, False, False, False, False, False, False, False, False, False, False, True, False, False, False, False, False, False, False]) Then we can pass this new array of boolean values to select only two columns:
df . iloc [:, run_cols ] . head () | Running | Runs from | |
|---|---|---|
| 0 | False | False |
| 1 | True | True |
| 2 | False | False |
| 3 | False | True |
| 4 | False | False |
In practice, many people will use a lambda function to do this in one line:
df . iloc [:, lambda df : df . columns . str . contains ( 'run' , case = False )] The benefits of using str functions are that you can get sophisticated with the potential filter options. For instance, if we want all the columns with "district," "precinct" or "boundaries" in the name:
df . iloc [:, lambda df : df . columns . str . contains ( 'district|precinct|boundaries' , case = False )] . head () | Community Districts | Borough Boundaries | City Council Districts | Police Precincts | |
|---|---|---|---|---|
| 0 | 19 | 4 | 19 | 13 |
| 1 | 19 | 4 | 19 | 13 |
| 2 | 19 | 4 | 19 | 13 |
| 3 | 19 | 4 | 19 | 13 |
| 4 | 19 | 4 | 19 | 13 |
We can even combine all these concepts together by using the results of the boolean array to get the index then use np.r_ to combine these lists together.
The example below can be simplified by using filter . Please review the next section for an explanation of filter and how to use it with a regular expression.
Here is an example where we want to get all the location related columns as well as the squirrel ID into a DataFrame:
location_cols = df . columns . str . contains ( 'district|precinct|boundaries' , case = False ) location_indices = [ i for i , col in enumerate ( location_cols ) if col ] df . iloc [:, np . r_ [ 0 : 3 , location_indices ]] . head () | X | Y | Unique Squirrel ID | Community Districts | Borough Boundaries | City Council Districts | Police Precincts | |
|---|---|---|---|---|---|---|---|
| 0 | -73.956134 | 40.794082 | 37F-PM-1014-03 | 19 | 4 | 19 | 13 |
| 1 | -73.957044 | 40.794851 | 37E-PM-1006-03 | 19 | 4 | 19 | 13 |
| 2 | -73.976831 | 40.766718 | 2E-AM-1010-03 | 19 | 4 | 19 | 13 |
| 3 | -73.975725 | 40.769703 | 5D-PM-1018-05 | 19 | 4 | 19 | 13 |
| 4 | -73.959313 | 40.797533 | 39B-AM-1018-01 | 19 | 4 | 19 | 13 |
This code is a little complicated since we are using a conditional list comprehension and might be overkill for selecting 7 columns. The important concept is that you know it is possible and can refer back to this article when you need it for your own analysis.
Filter
In the original article, I did not include any information about using pandas DataFrame filter to select columns. I think this mainly because filter sounds like it should be used to filter data not column names. Fortunately you can use pandas filter to select columns and it is very useful.
If you want to select the columns that have "Districts" in the name, you can use like :
df . filter ( like = 'Districts' ) | Community Districts | City Council Districts | |
|---|---|---|
| 0 | 19 | 19 |
| 1 | 19 | 19 |
| 2 | 19 | 19 |
| 3 | 19 | 19 |
| 4 | 19 | 19 |
| … | … | … |
| 3018 | 19 | 19 |
| 3019 | 19 | 19 |
| 3020 | 19 | 19 |
| 3021 | 19 | 19 |
| 3022 | 19 | 19 |
You can also use a regex so it is easy to look for columns that contain one or more patterns:
df . filter ( regex = 'ing|Date' ) | Date | Running | Chasing | Climbing | Eating | Foraging | |
|---|---|---|---|---|---|---|
| 0 | 10142018 | False | False | False | False | False |
| 1 | 10062018 | True | False | False | False | False |
| 2 | 10102018 | False | False | True | False | False |
| 3 | 10182018 | False | False | True | False | False |
| 4 | 10182018 | False | False | False | False | False |
| … | … | … | … | … | … | … |
| 3018 | 10072018 | False | False | False | True | True |
| 3019 | 10132018 | False | False | False | False | True |
| 3020 | 10122018 | False | False | False | True | True |
| 3021 | 10102018 | False | False | False | True | False |
| 3022 | 10122018 | False | False | False | True | True |
The more complex lambda example shown above could be much more succinctly created using filter :
df . filter ( regex = 'District|Precinct|Boundaries' ) Caveats
One item to keep in mind when dealing with numerical indexing of columns is that you need to understand where your data comes from. If you expect you ID column to always be in a specific location and it changes order in the data, you could face problems with your subsequent data processing. This situation is where your domain knowledge and expertise comes into play to make sure the solution is robust enough for the given situation.
Summary
Most of my data analysis involves filtering and selecting data at the row level. However there are times when it is helpful to work with data in a column-wise fashion. Pandas iloc and filter can be a useful tool for quickly and efficiently working with data sets that have many columns of data. I hope this article provided a couple of tips that will help you with your own analysis.
Changes
- 1-Dec-2019: Updated typos and clarified read_clipboard usage to use tab delimiter.
- 24-July-2020: Include using
filterto select columns.
Source: https://pbpython.com/selecting-columns.html
0 Response to "Automatically Extract Continuous Columns in Pandas"
Post a Comment